Customers & Audience Dashboard
What This Guide Does — Shows how to read high-level customer health, messaging, and engagement metrics on the Customers & Audience Dashboard.
Why It Is Useful — Gives you a quick overview of customer health and engagement without digging into every individual page, so you know at a glance whether contacts, messaging, and automations are trending up or down.
How to Use It
Open Customers & Audience Dashboard
The Customers & Audience Dashboard gives a quick overview of customer health and engagement.
Choose Time Range
Today, Last 7 Days, Last 30 Days, or Last 90 Days. A "Last updated" indicator confirms the data is fresh.
Review Core KPI Metrics
Tiles summarize Total Customers, Engaged Customers, Active Automatic Messages, and One-Time Messages Running.
Check Messaging Performance
See Messages Sent and Delivery Rate. Green or red shows the change vs. the previous period.
Analyze Trends & Contact Stages
The Contact Growth Trend line chart shows contact movement over time. The Customers by Stage donut chart shows how contacts are distributed across stages.
Review Delivery Funnel & Recent One-Time Messages
The Message Delivery Funnel shows message outcomes (Pending, Delivered, Failed, Consent Skipped). Recent One-Time Messages lists your latest campaign activity.
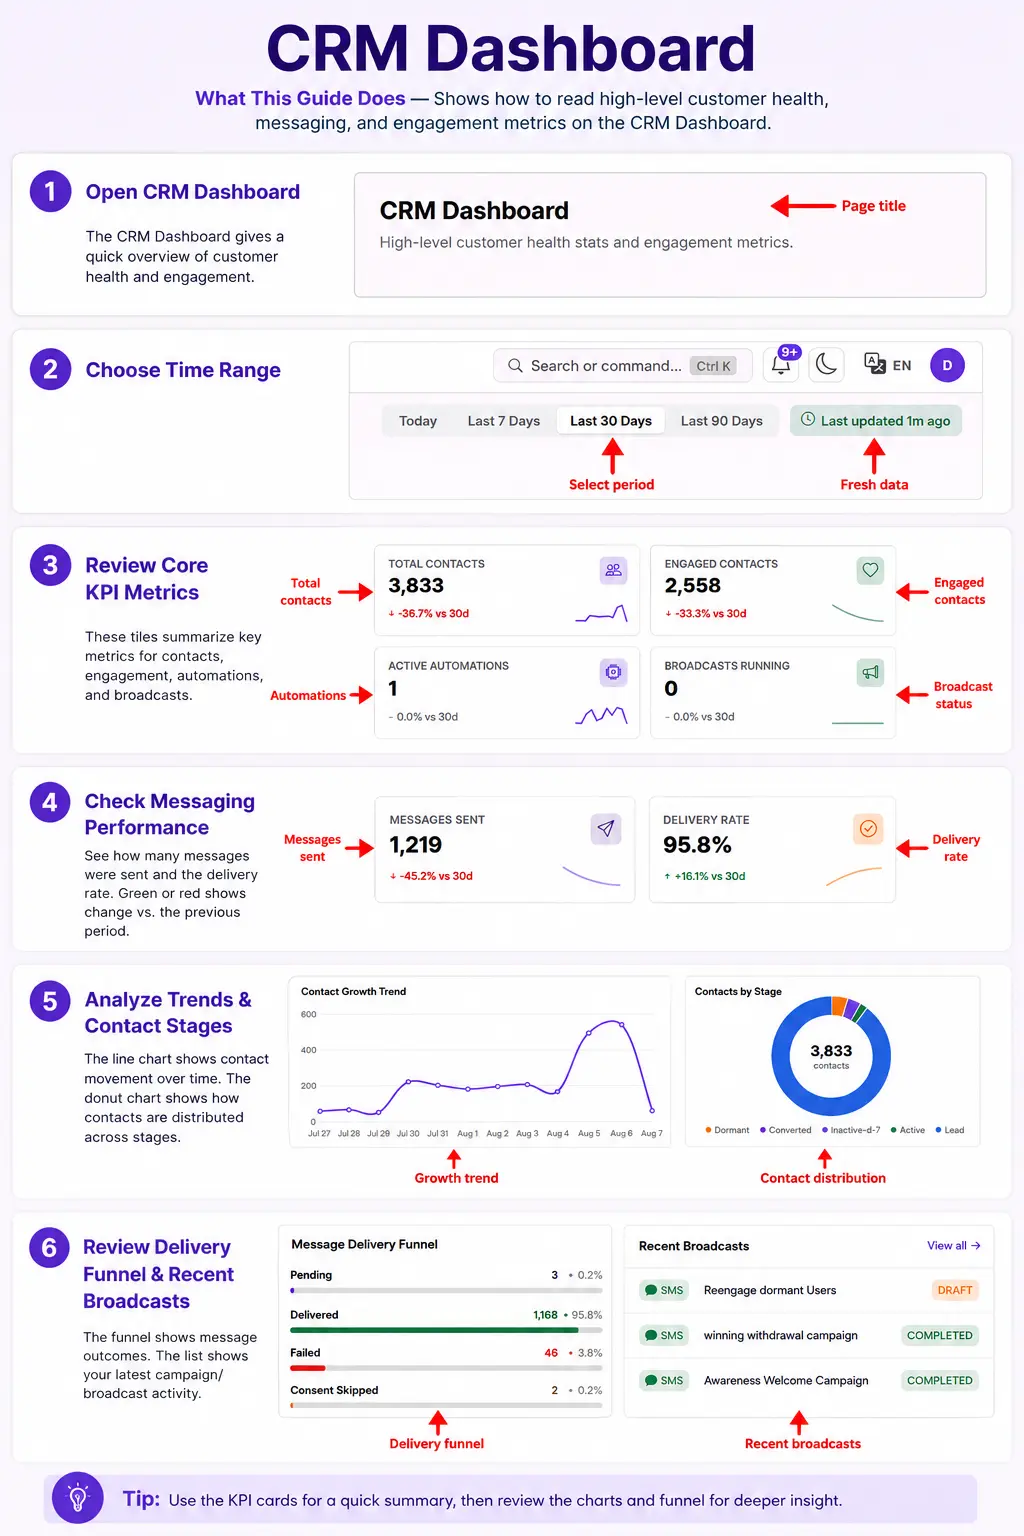
What You Should See — A row of KPI tiles for a quick summary, backed by charts and a funnel you can review for deeper insight into contact growth, stage distribution, and message delivery.
Tips
- Use the KPI cards for a quick summary, then review the charts and funnel for deeper insight.
Related Guides