Reading the Overview Dashboard
What This Guide Does — Use this dashboard to monitor performance, spot issues, and explore important business metrics.
Why It Is Useful — The dashboard gives you a single, at-a-glance view of how your marketing, sales, and engagement are performing, plus AI-surfaced issues that need your attention, so you know where to focus without digging through separate reports.
How to Use It
Start at the Overview Dashboard
Start here to review the selected period, read the daily summary, and check urgent alerts.
Read the KPI Metrics
These cards show your most important key performance indicators at a glance.
Open a KPI for Details
Click a metric such as Impressions to view the trend and data source.
Check the Marketing Funnel
Use the funnel to understand how people move from visibility to conversion.
Drill Down into a Funnel Stage
Open a stage like Awareness to see the trends and the content or ads driving results.
Review Revenue and Ad Spend
Use this chart to compare revenue performance with advertising spend.
Monitor Customers and Conversions
Use this section to see how new contacts enter the system and how many convert.
Read AI Insights
AI Insights highlights problems or opportunities that may need action.
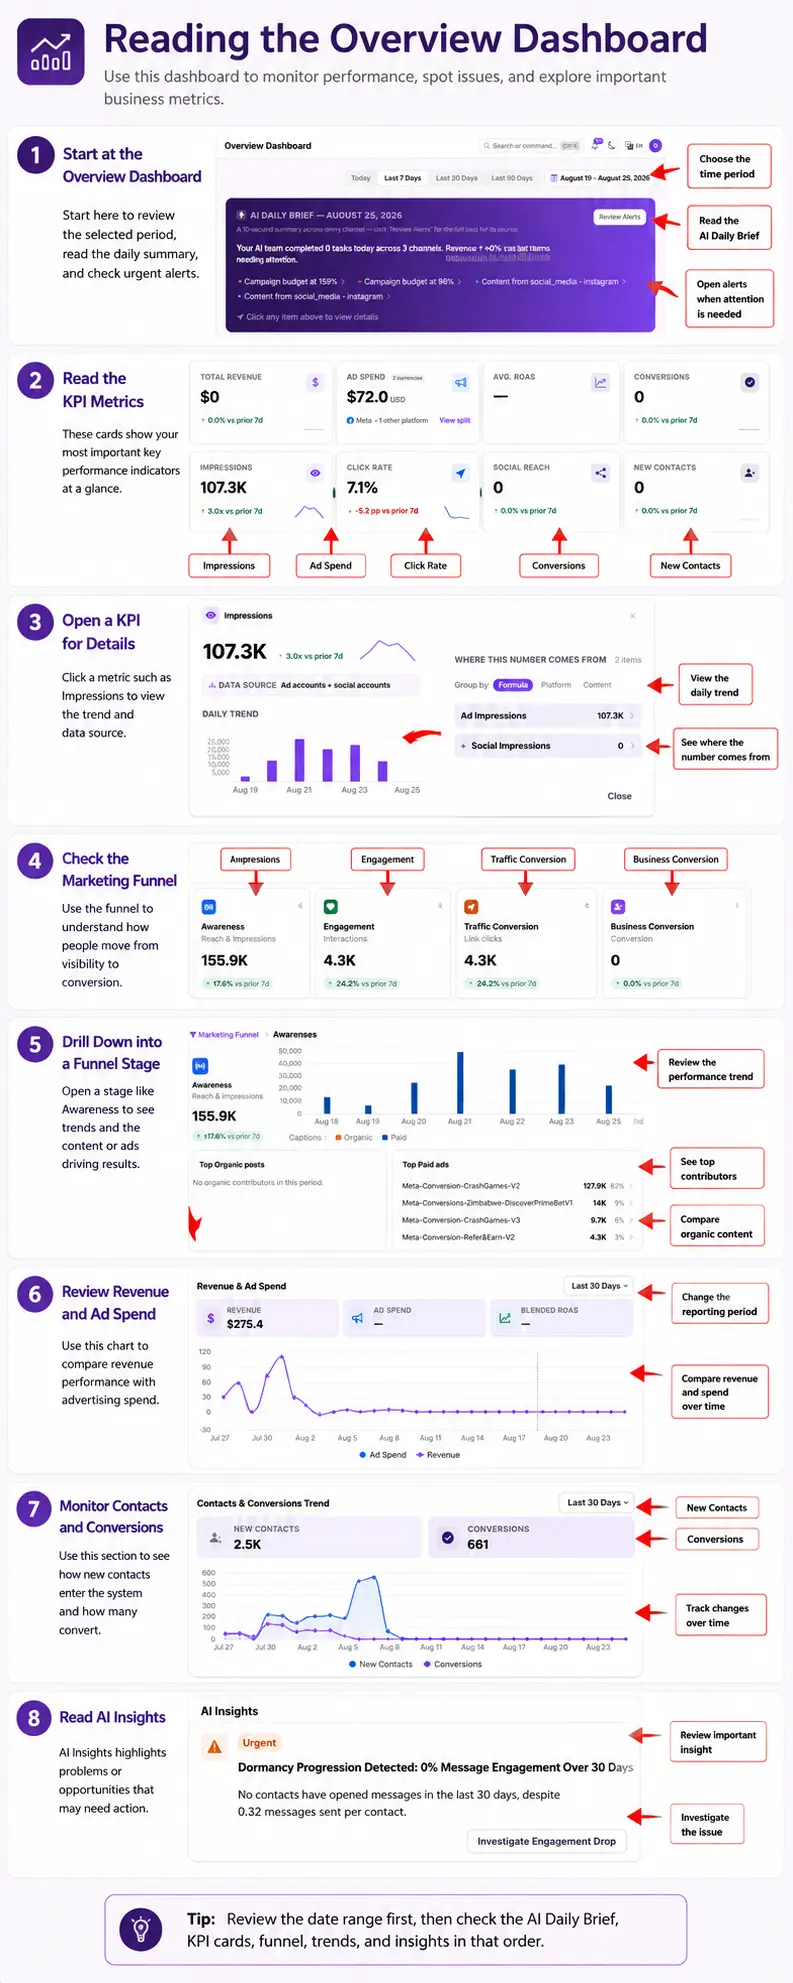
What You Should See — A single scrolling dashboard: the AI Daily Brief banner at the top, a row of KPI cards you can click into for a trend and data source, the Marketing Funnel with drill-down into each stage, the Revenue & Ad Spend and Customers & Conversions trend charts, and the AI Insights panel at the bottom listing any current alerts.
Tips
- Review the date range first, then check the AI Daily Brief, KPI cards, funnel, trends, and insights in that order.
Related Guides