
Drill-down on any KPI
By channel, campaign, content, source or stage, depending on the metric. Where several currencies are involved the metric splits by platform rather than silently adding them up.
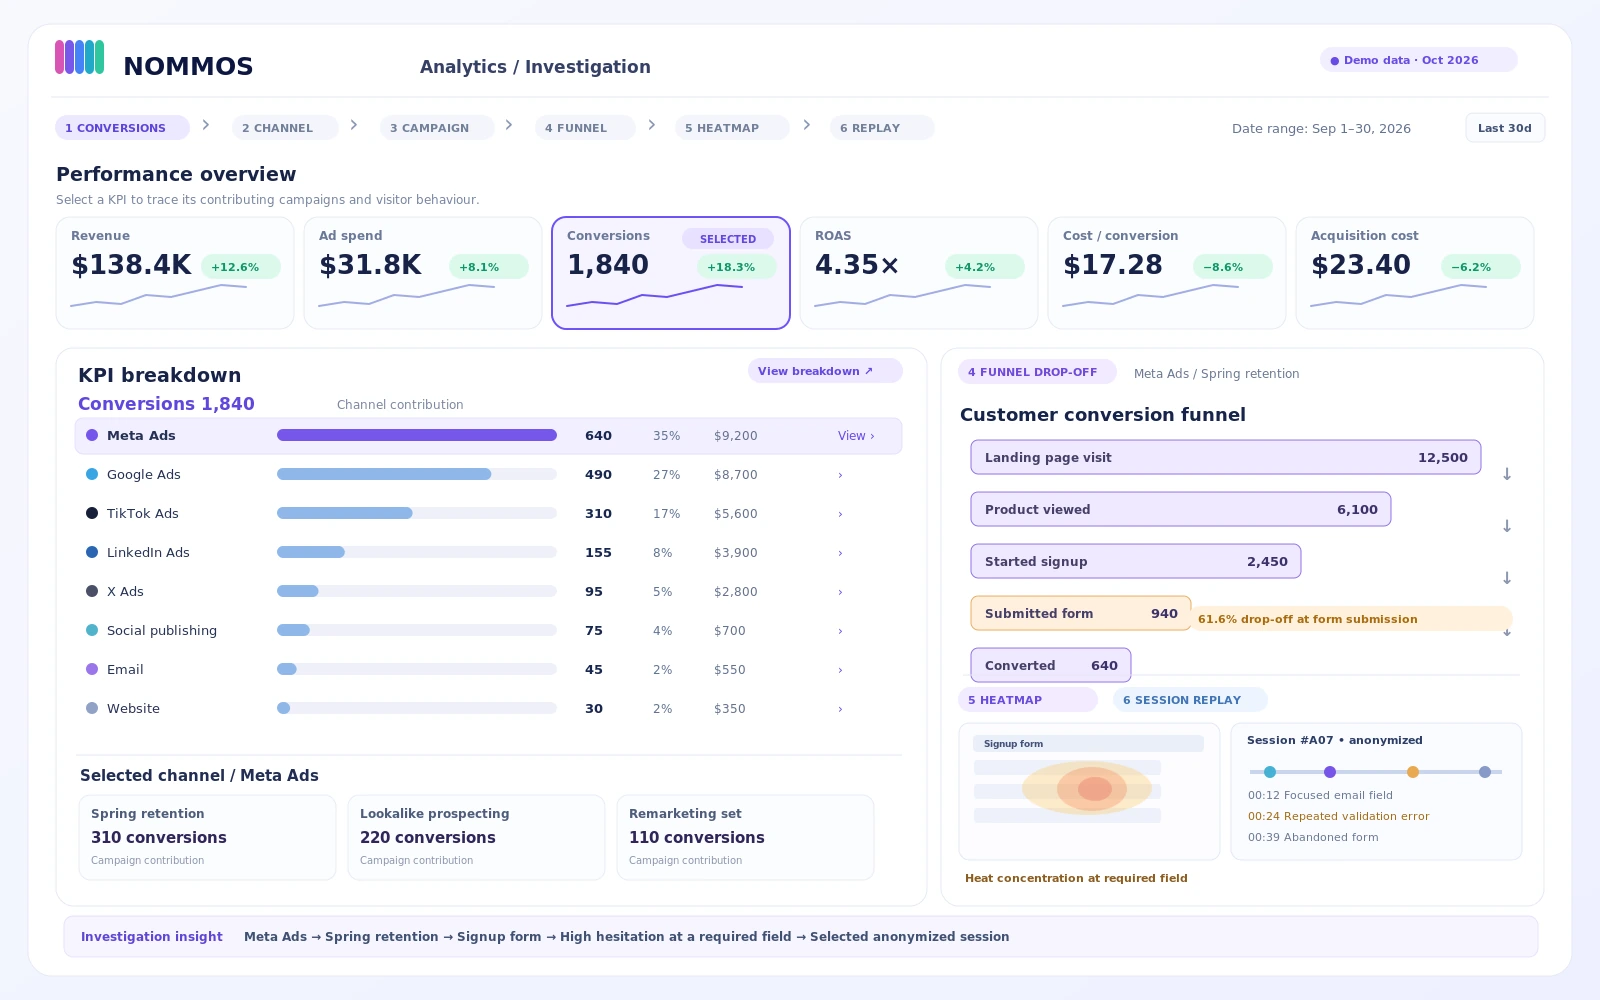
“Conversion is 2%” is not an answer. This is: the funnel names the step losing people, the heatmap shows that page, and the recordings show individual people getting stuck.
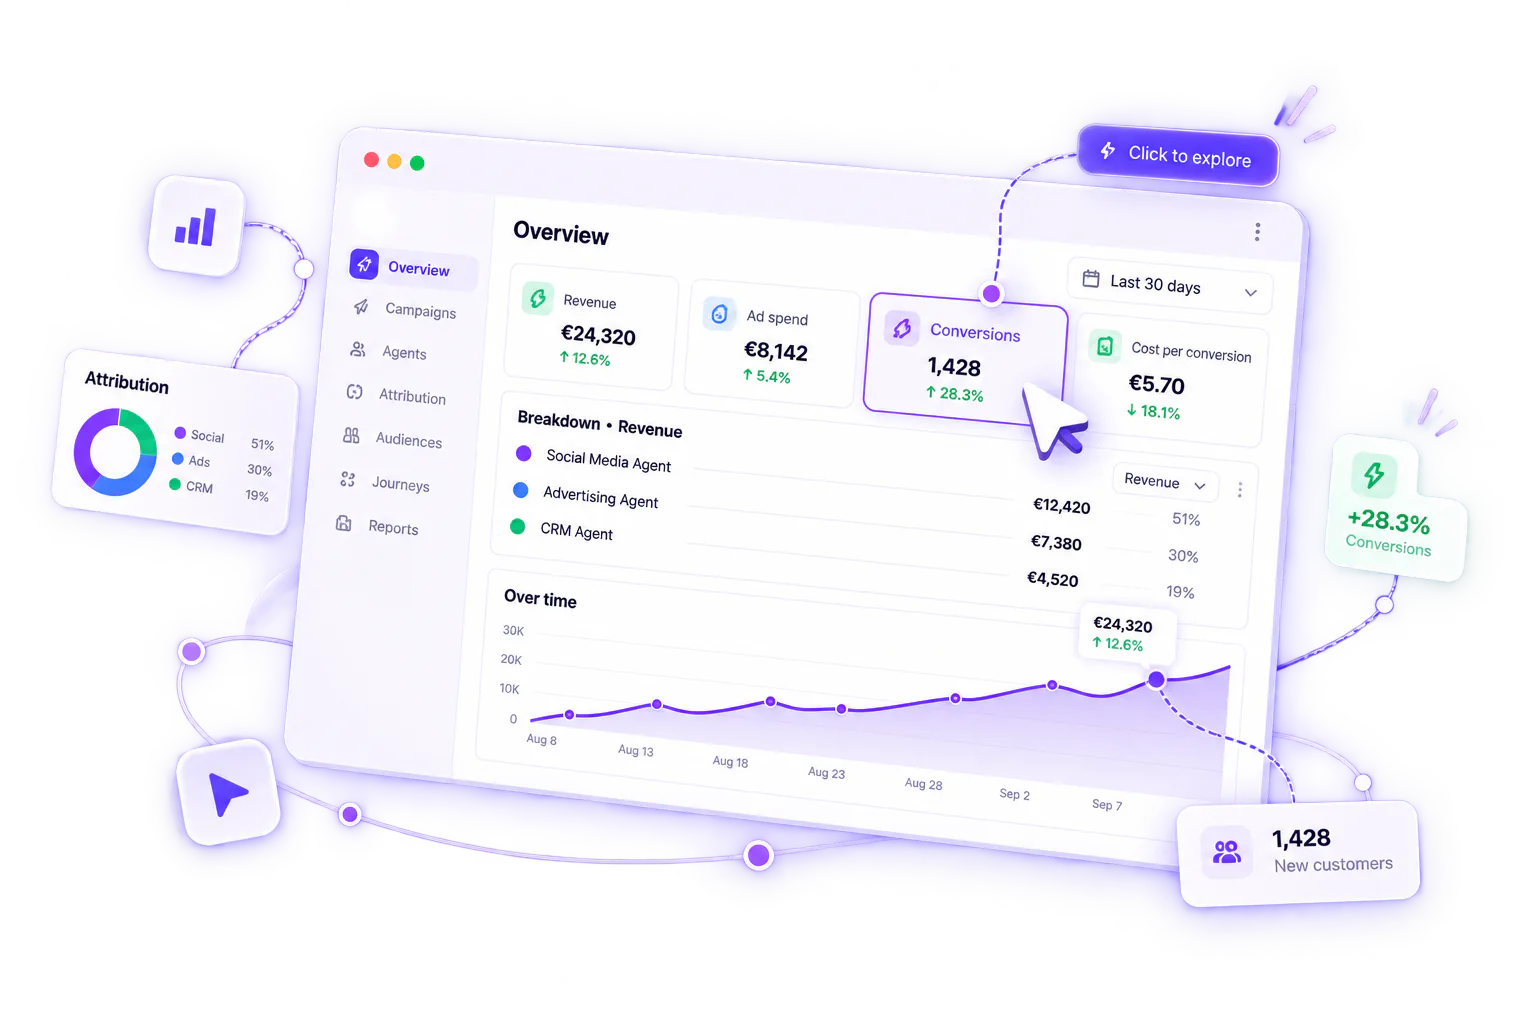
Answering “how are we doing?” normally takes five to seven tools and produces numbers that disagree. This screen holds one version, and will show its components.
By channel, campaign, content, source or stage, depending on the metric. Where several currencies are involved the metric splits by platform rather than silently adding them up.
Each carries a line saying where it came from — “Ad accounts + social accounts”, “CRM contacts”, “Tracking pixel — conversion events”.
Build the metric your business actually runs on from a formula of metrics and constants, with a running value shown as you build, rendered as a card, line, bar or doughnut.
Move blocks, hide the ones that don't apply, set full or half width, restore the default. A brand with no paid spend stops seeing empty ad charts.
Each step links to the next inside the product. The heatmap links to the matching recordings; the segment you build from what you learn is usable immediately by a journey or an ad audience.
Move from a headline metric to its channel and campaign contribution, then investigate the customer behaviour behind a drop-off.
Open revenue, spend, conversions or ROAS and see the contribution from each connected channel and campaign.
Follow the conversion funnel to the exact page or journey stage where engagement falls.
Use heatmaps and session recordings to understand what visitors clicked, how far they scrolled and where they became stuck.
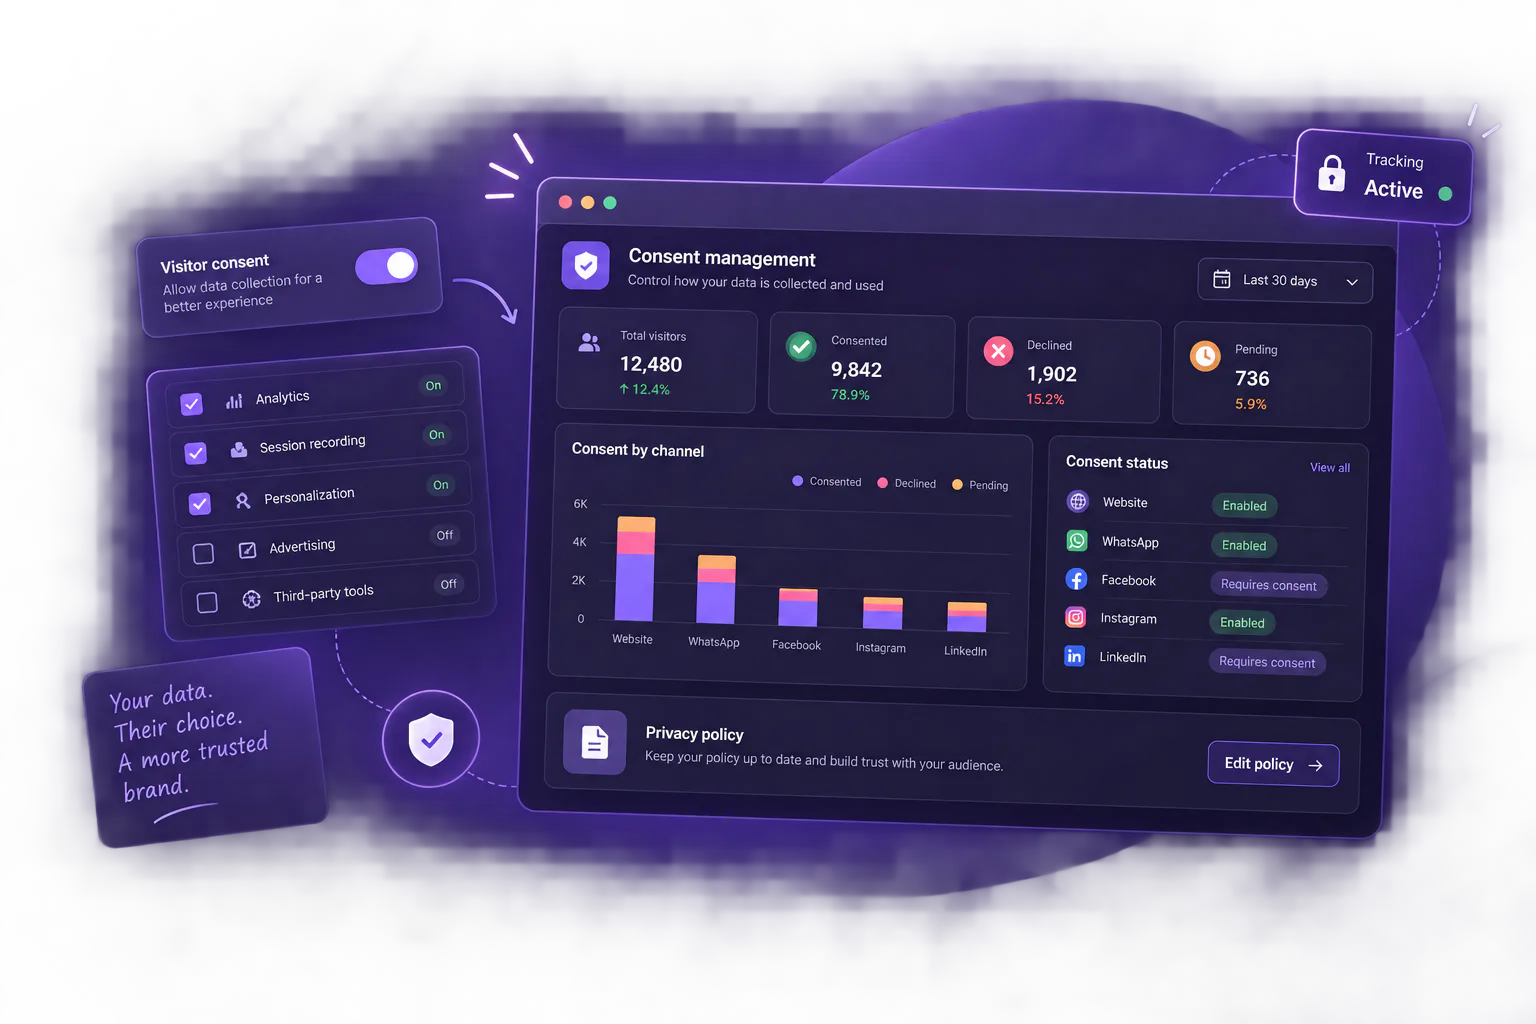
A tracking library for the web, with dedicated packages for Angular and React and a native library for Android. Set-up is a token and a few lines of configuration — and the library then loads its settings from Nommos, so features can be switched on and off later without touching your site again.
Most teams buy this separately. It is built into the tracking library and matches your brand.
We'll click it and show you the components. That is usually the fastest way to judge whether a consolidated dashboard is real.