
One customer record
The CRM manager can see what the ads are promising. The media buyer can see which customers already converted. Neither has to ask.
You own the number and you report upward. Nommos gives you a dashboard where any figure can be clicked and explained — and a team that spends its week deciding rather than producing.
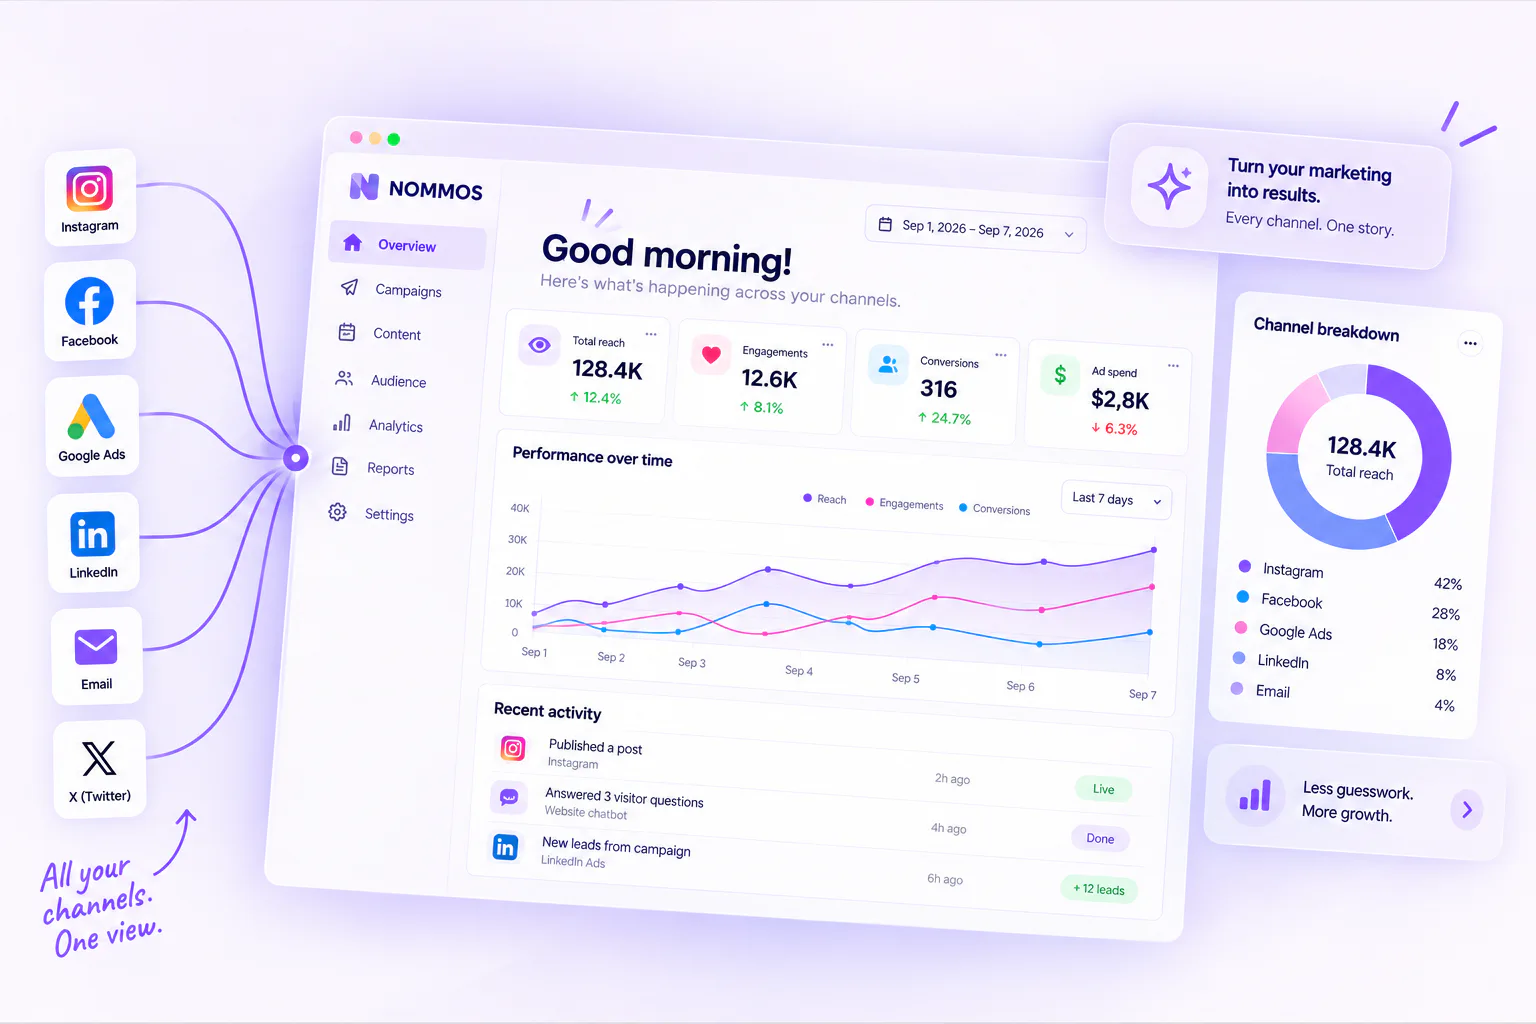
Open seven tools. Copy numbers into a spreadsheet. Discover the date ranges do not align. Fix it. Discover two tools disagree on clicks. Pick one. Build the slide. Present a week that finished three days ago, and field questions you cannot answer in the room.
The dashboard is the report. The period selector moves every number together. When someone questions a figure, you click it and show the components while the question is still being asked.
The CRM manager can see what the ads are promising. The media buyer can see which customers already converted. Neither has to ask.
With a visible breakdown behind it, so disagreements end in the meeting rather than in a follow-up.
The metric you actually run on — cost per qualified signup, revenue per active contact — lives on the dashboard instead of in a spreadsheet.
An analyst, a freelancer and an administrator each get exactly the access the work requires.
A number is not a diagnosis. This sequence turns one into the other, and each step links to the next inside the product.
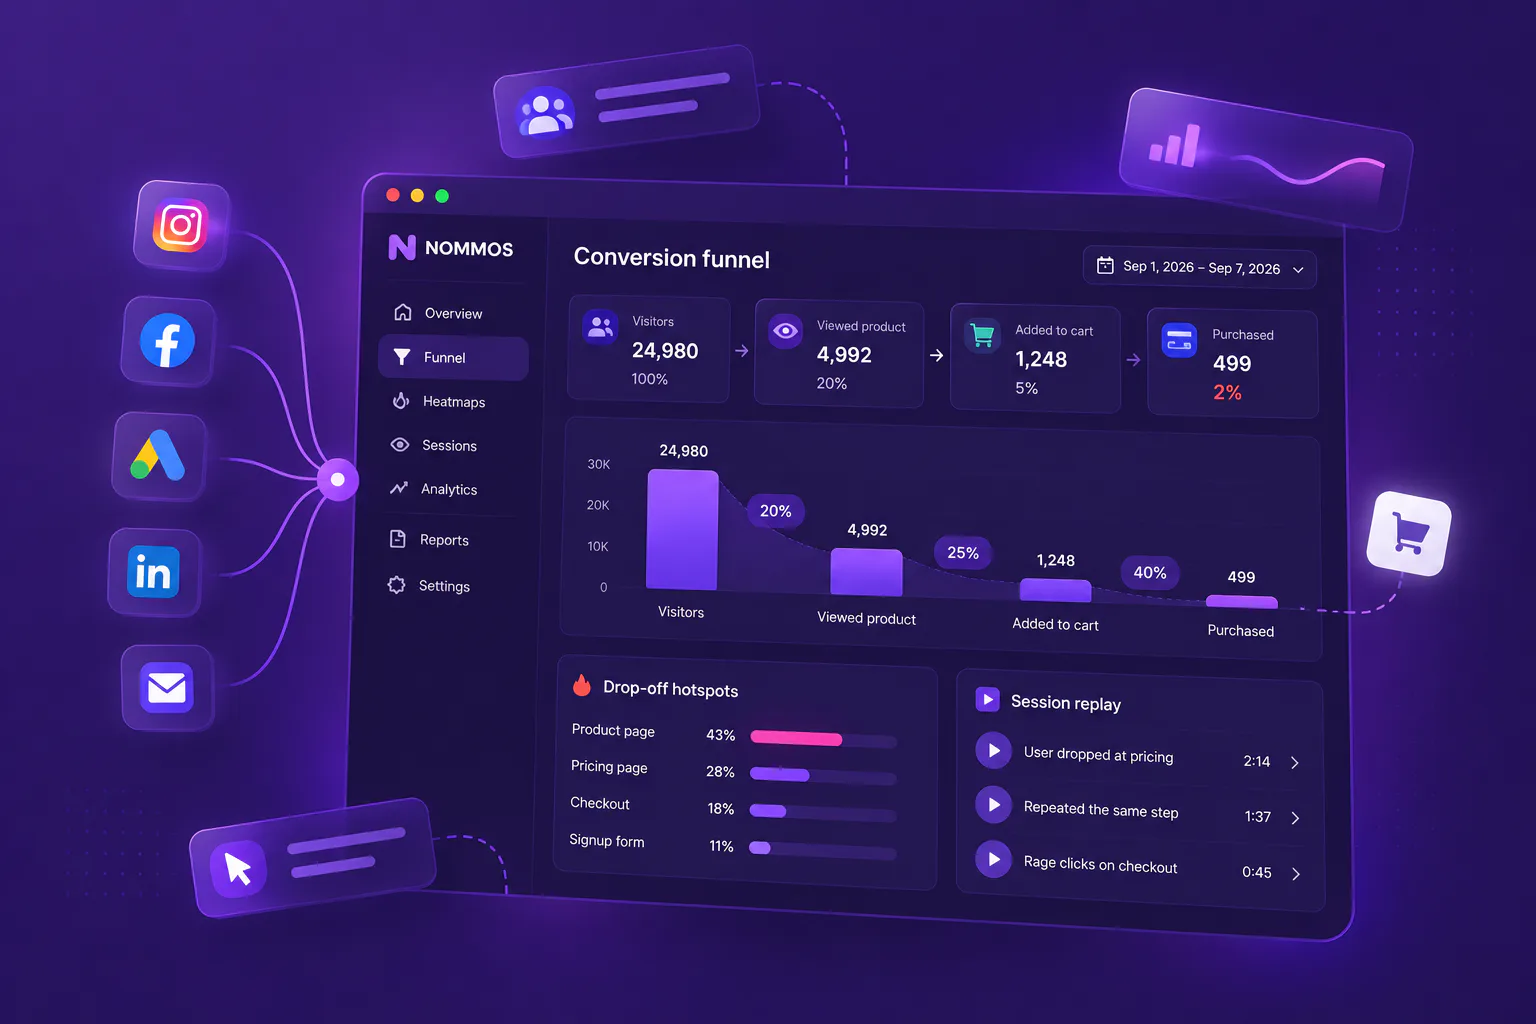
Churn risk, engagement, conversion probability and channel preference are not a separate analytics view. They are conditions in the segment builder.
ML Insights flags it with severity, a seven-day trend, the top driver and how many contacts are affected.
The contact list opens with that audience already applied as a filter.
Not the whole insight — the specific cause within it.
It drafts the campaign and waits for your approval before creating anything.
We will click it and show you the components. It is the fastest way to judge whether a consolidated dashboard is trustworthy.